Why we need ecosystem manipulation experiments to reveal the coupled C-N system’s behaviour

In this blog, I’m going to argue why it is crucial to use observational data from ecosystem manipulation experiments (EME) for model evaluation and calibration. And I’m going to make this case using the example of nitrogen limitation and how EMEs guided the development of Dynamic Global Vegetation Models (DGVMs) over the last one-and-a-half decades and repeatedly exposed their deficiencies. This, I hope, will convince you that there is a great future in a close relationship between modellers and experimentalists around the data from EMEs.
First, a brief clarification about the relationship between models, in particular DGVMs, and data. DGVMs are process-based representations of ecosystem functioning and provide a bottom-up description of vegetation and biogeochemical cycles by explicitly simulating stand-level processes such as photosynthesis, growth, carbon allocation, mortality, fire, etc. This type of model contrasts statistical models, for example species distribution models, where statistical relationships, determined from data, are used to relate environmental variables to the model’s state variables of interest. In DGVMs, explicit processes are described by equations and parameters that can be directly measured. The simulated interplay of these processes finally governs higher-levels variables, such as NPP (see Fig. 1). Therefore, just to clarify, DGVMs don’t directly “use” data. Instead, data can be used indirectly to constrain or calibrate the parameters in DGVMs.
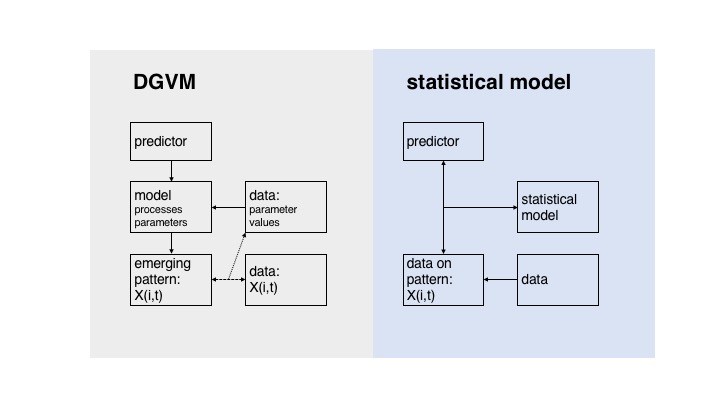
The relationship of models and data in DGVMs and statistical models.
Now, why is the data from manipulation experiments so particularly interesting?
From looking at a range of observational benchmarking datasets, one may conclude that DGVMs are a good representation of the functioning of the terrestrial biosphere. They do a fairly good job at capturing the current state and reliably simulate the global distributions of biomes, biomass, soil C stocks, and GPP. One may also look at the seasonality of C uptake and release fluxes: (One of the success stories of DGVMs is that they simulate the “breathing of the biosphere”) and even at the mean of the net terrestrial C balance and conclude that these models up to the job (Le Quere et al., 2016). And they have been up to that job since more than a decade.
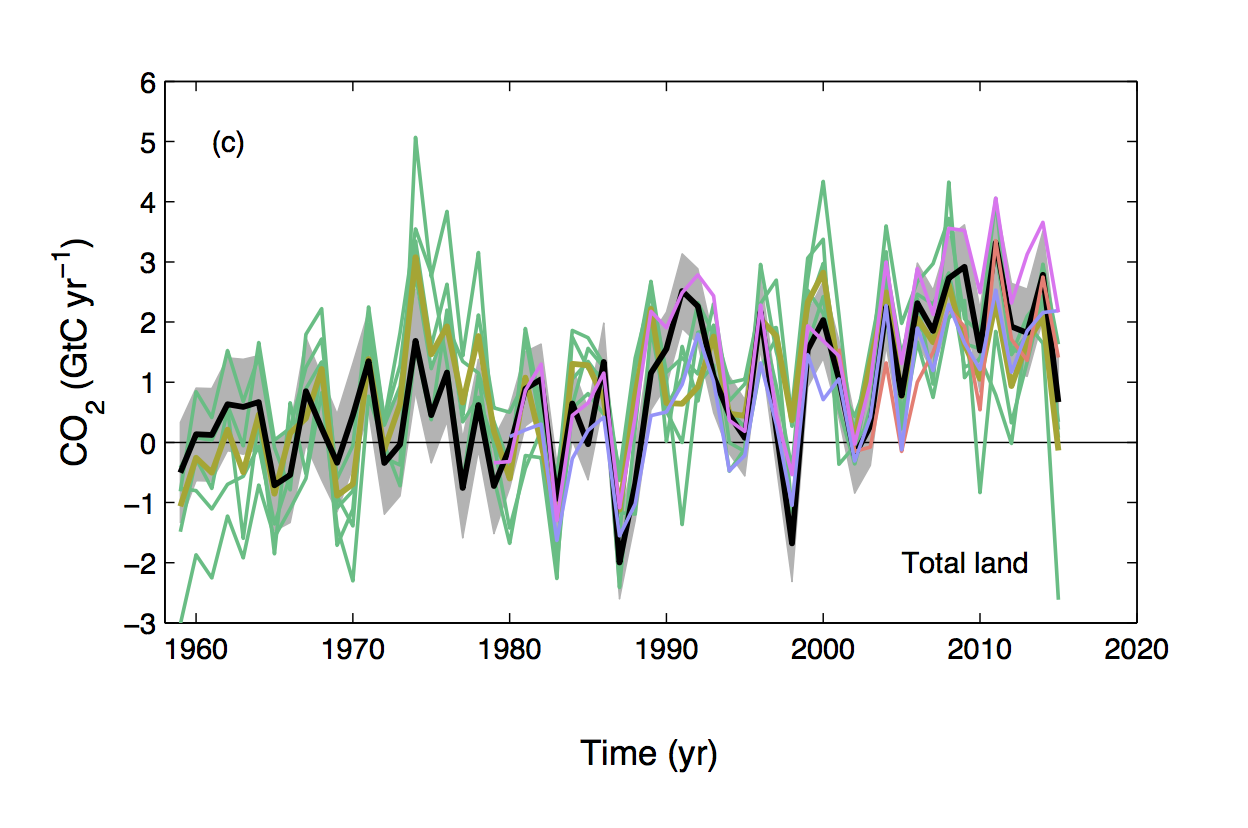
Fig. 2 Terrestrial C balance from the global carbon budget (black) and a set of DGVMs (figure from Le Quere et al., 2016).
Back then, about a decade ago, the first generation of DGVMs predicted that the land biosphere will act as a large and persistent C sink under continuously rising CO2 (Cramer et al., 2001; Friedlingstein et al., 2006). This prediction made it into the IPCC AR4 (Prentice et al., 2007) and these types of vegetation models were adopted as components in coupled Earth System Models that are used for climate projections still today. But at around the same time appeared the first results from long-term ecosystem manipulation experiments. Their results suggested that this sustained land C sink is no longer supported by insights from Free-Air-CO2-Enrichment (FACE) experiments and multiple studies found that N is the dominant factor limiting plant growth (Schneider et al., 2004; Norby et al., 2010; Reich & Hobbie, 2012). None of the DGVMs yet accounted for such limiting effects. Therefore, speculations were made about the mechanisms that would lead to such an outcome that develops over several years. The Progressive Nitrogen Limitation (PNL) hypothesis was proposed (Luo et al., 2004) which suggests that upon a (e.g. CO2-induced) stimulation of growth, N gets locked up in live biomass and depleted in the soil. This would lead to an increase in the tissue C:N ratio which, when added to litter, would further reduce soil net N mineralisation and N availability. The initial growth stimulation would progressively disappear. However, observational evidence for the PNL was not clear and an alternative hypothesis, stating that increased belowground C inputs would stimulate N mineralisation, could not be excluded either (Reich & Hobbie, 2012). A key point I want to make here is that evidence for such mechanisms coming from the a few experiments is to some degree anecdotal and we’re sometimes faced with counterintuitive results that fit none of the popular hypotheses (see e.g. Feng et al., 2015). Our understanding of the systems’ functioning has to be coded up in the form of a quantitative, process-based model. Only this gives us predictive capabilities.
Anyway, what stuck regarding N limitation was the Perspectives paper by Hungate et al. (2013) in Science where they argued that the C sequestration simulated by C-only DGVMs implies that an amount of N would become available that was far beyond their estimate.
This set the target for the modelling community: “We need a N cycle”. And what should it do? Limit something. For example GPP (see CLM model) or NPP (see most other models). Liebig’s Law of the Minimum sounds like a reasonable approach and in Fortran there is even a function: MIN( potential_X, limited_X ). And if the assimilated C cannot be matched by N taken up from the soil, excess C is respired back to the atmosphere. Finally, we probably want to increase tissue C:N ratios when N is limiting so we would get something like the PNL with the model (although there is no observational evidence for it). A few years later, the first modelling groups proclaimed: “We now have a nitrogen cycle in our model”.
Of course, these models had to pass the usual tests against observational data: C stocks and fluxes. And now, that loads of data has become available, systematic benchmarking and model parameter calibration using Bayesian statistics was by now high on the agenda of modellers. With a few necessary tweaks, the models still performed well when faced with the benchmarks and after all, the models were now a good deal more realistic.
But something fundamental changed. By the time IPCC AR5 was published only two ESMs with a land component simulating the interactions between C and N cycles were included. These showed a strongly muted response to both CO2 and climate (Fig. 3). Over the years, as more models came along, the muted response to CO2 and climate was corroborated (Achat et al., 2016). A strong N limitation is simulated by these types of models. This, in general, satisfied Hungate’s objection. That gave the community enough confidence to take on the next step as the next big resource limitation was looming: phosphorous. The predictions of these latest types of DGVMs that account for both N and P limitation is hardly surprising: An even stronger reduction of the simulated land C uptake under scenarios of rising CO2 (Wieder et al., 2015, Achat et al., 2016).
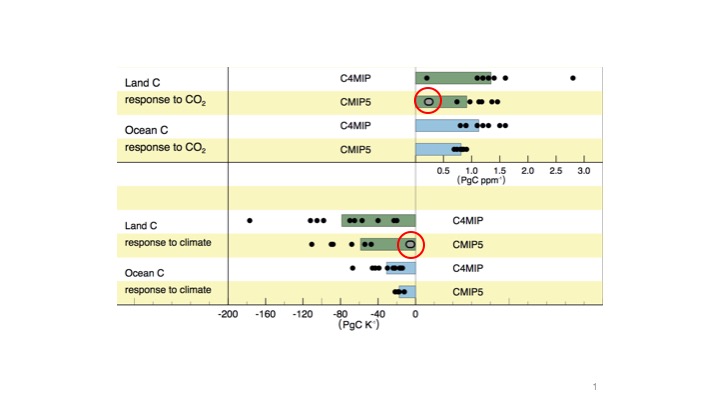
Fig. 3 Carbon cycle feedbacks with climate. Models where the land component includes coupled C-N cycling are highlighted by red circles. Figure from Ciais et al. (2013), IPCC AR5, Chapter 6.
However, there is a problem with these models. And this problem was revealed by an in-depth model evaluation against two ecosystem manipulation experiments (Zaehle et al., 2014; De Kauwe et al., 2014). A suite of models with interactive C and N cycles were evaluated against observational data from the Duke and ORNL FACE experiments. The importance of what this evaluation revealed cannot be overstated. In brief, it showed that all models get the right response (NPP stimulation under elevated CO2) for the wrong reasons (increasing tissue C:N instead of increasing N uptake, Fig. 4). And it did so by evaluating the sensitivities of mechanisms and their interactions in response to a large perturbation. The system is hit hard enough to reveal the relevant mechanism that finally determine the strength and persistence of the CO2 fertilisation effect. The important lesson from this is that none of the other typical benchmarking datasets would not enable such insights. Sensitivities are only becoming apparent if the system is pushed to a completely different state. Only by looking at data from ecosystem manipulation experiments.
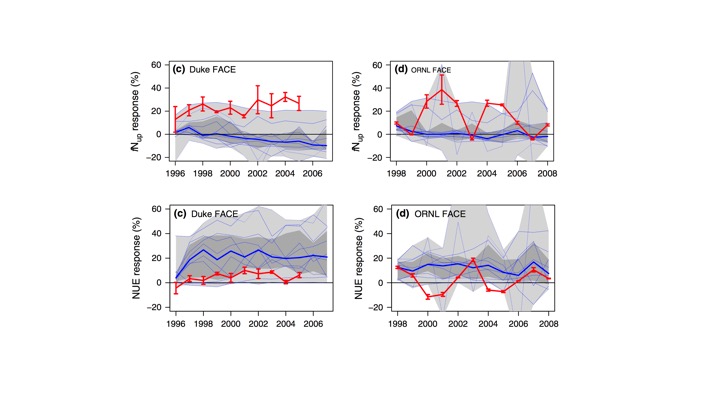
Fig. 4 Observed (red) and simulated (blue) relative change in N uptake (top) and nitrogen use efficiency (N-uptake/NPP, bottom) in experiments Duke FACE (left) and ORNL FACE (right). Figure from Zaehle et al. (2014)
We have a problem and where do we go from here?
An essential insight from the analysis by Zaehle et al. (2014) is that the increase in N uptake under elevated CO2 was massively underestimated. In other words, there must be mechanisms by which plants can acquire additional N if needed and that these mechanisms are missing in models. How does this relate to the indusputable effect of N limitation? How can ecosystems be limited by N, yet get addtional N under elevated CO2? What are the limits to this? How flexible are these bounds of N and P availability that underlie the argument by Hungate and Penuelas? And can we model this?
The theory is there to resolve this apparent contradiction. It may all make sense in the view of a evolution and the tendency for optimal functioning. In that sense, optimal growth tends to achieve a functional balance (Davidson, 1969). The underlying hypothesis is that plants optimise their growth strategy and C allocation in the face of multiple limiting resources. They thereby achieve a functional balance between aboveground and belowground growth and stimulation of the rhizosphere. Hence, plants may get additional N but it comes at the cost of root growth and exudation of labile C into the rhizosphere. This may seem all too reasonable, if not obvious to you but it’s important to note that currently available DGVMs do not embody this theory. They do not simulate the essential trade-offs and sufficient flexibility in allocation. But such an approach is arguably a much cleverer way to simulate plants than to assume that excess assimilated C that is not matched by N uptake is pointlessly respired into the air. And simplified models, typically applied at the point-scale are available and have shown that this approach works. But what about observational evidence for such trade-offs?
Again, ecosystem manipulation experiments hold the answer. Here are some new results. To investigate the data, we adopted what one may call a “modelling perspective” and investigated just this trade-off. Cesar Terrer led this research where we posed the question “At what cost does the additional N uptake come?” Comparing data from plots under ambient and elevated CO2, we quantified the ratio of the relative increase in N uptake divided by the relative increase in belowground biomass or productivity. Here are the results that are soon going to be published in New Phytologist (Fig. 5):

Fig 5. (a) Relationship between the eCO2-induced relative change (%) in belowground C allocation (“investments”) and aboveground N-acquisition (“returns”) . (b) Mean, standard error, max and min return on investment (ΨN-1, Eq. 1). Figure from Terrer et al. (accepted).
It would be too nice to evaluate a range of C-N models against such data. Unfortunately, such detailed model-data analyses as done by the FACE-MDS project are extremely laborious. But we can identify a robust observation, for example a shift towards more belowground C allocation as CO2 increases and have a quick look at the TRENDY models to see whether they simulate such a response (Fig. 6).
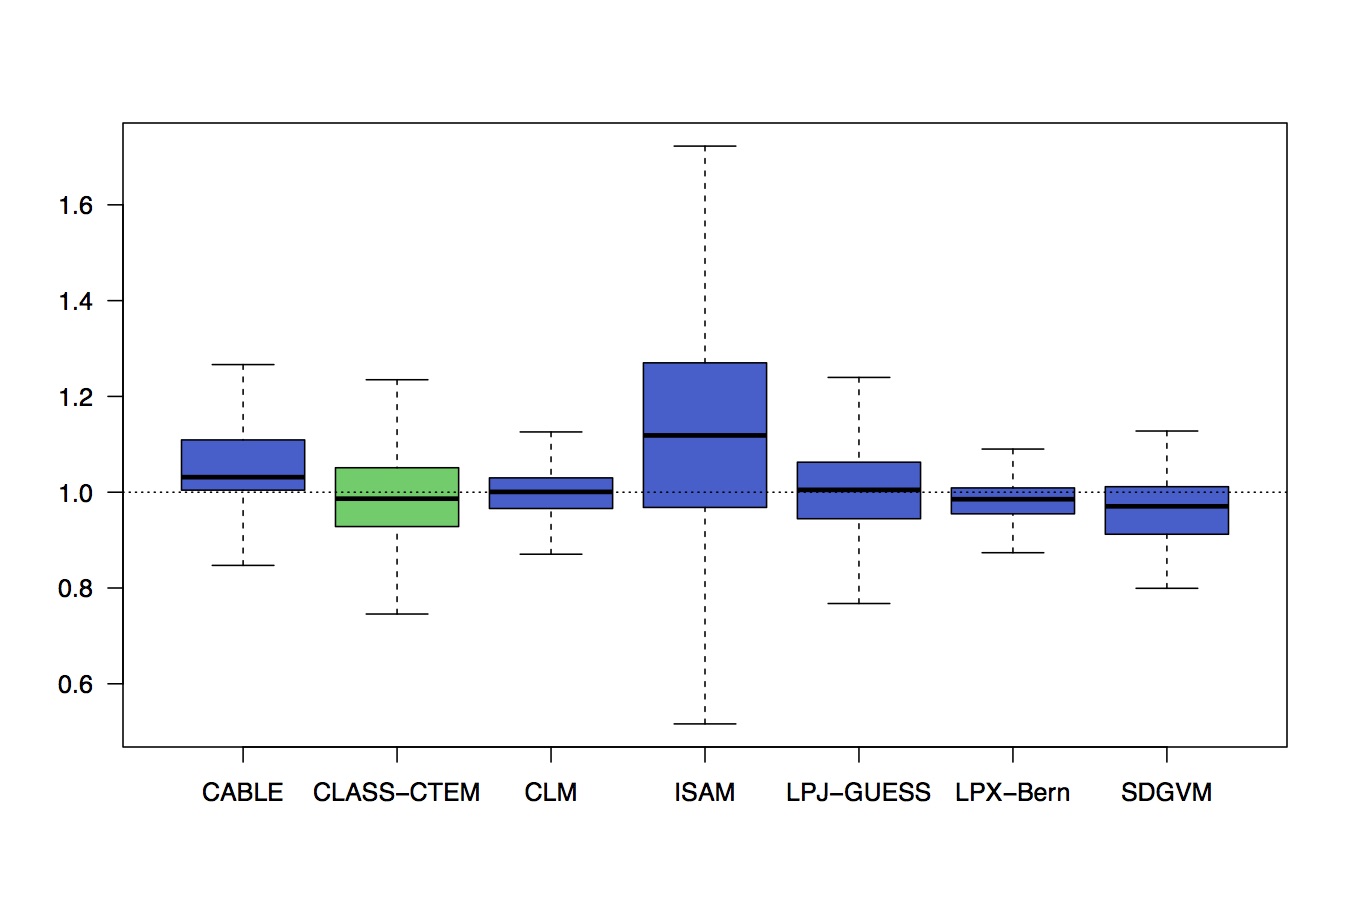
Fig. 6 Relative change in the ratio of root-to-leaf biomass in TRENDY models, derived from the CO2-only simulation (end vs. start period).
No. They’re not. But that’s hardly surprising since these models typically rely on formulations of allocation that are relatively rigid and do not properly simulate growth plasticity in response to shifts in resource availability.
In my own research, I’ve been working towards building a new type of DGVM that addresses this shortcoming. Inspired by the simpler models that simulate optimal allocation, I’ve put the necessary components together to simulate the coupled cycling of C and N in a grassland ecosystem, based on a functional balance approach. I’ve applied this model, forced by meteorological data and info on management (cutting, N fertilisation) from SwissFACE experiment. The comparison to observational data looks promising (Fig. 7):
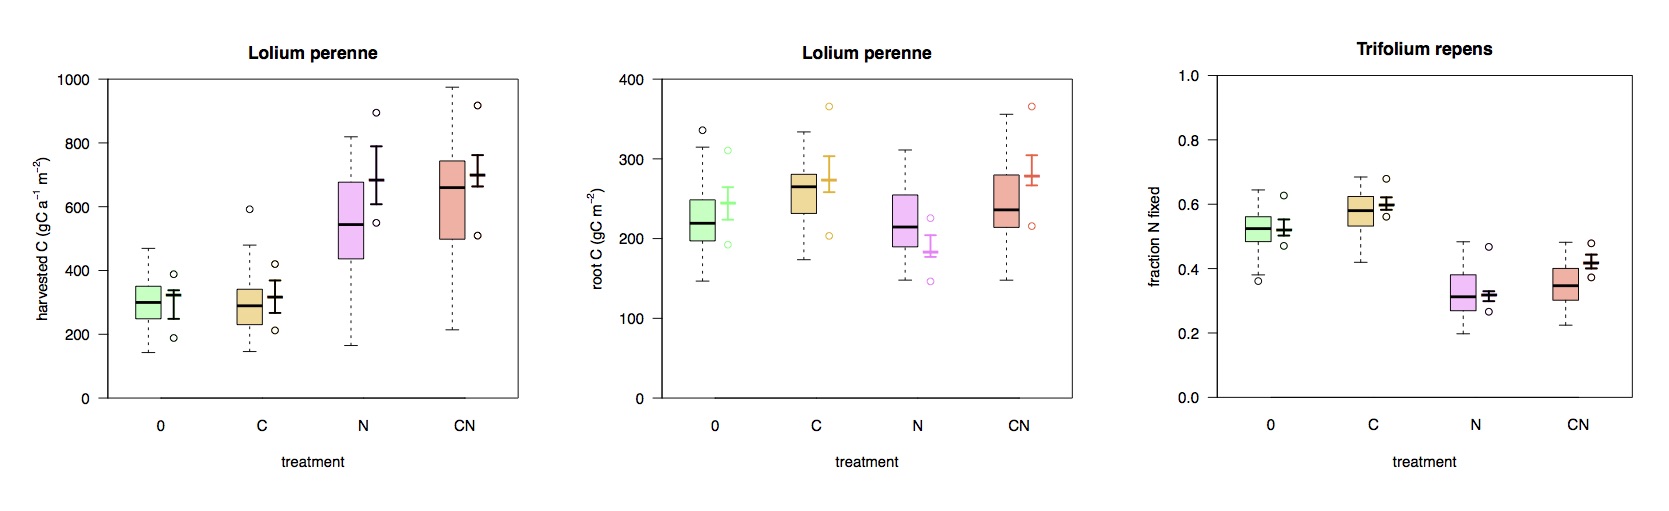
Fig. 7 Response in harvested aboveground biomass (left), root carbon (middle), and the fraction of N derived from biological N fixation (left). Simulated (black lines) and observed (boxes). Treatments are 0: control, C: elevated CO2, N: N fertilisation, CN: elevated CO2 and N fertilisation.
The model reproduces the strong N limitation of aboveground productivity and – what’s not known from the field measurements, but consistent with data from separate pot measurements – simulates a shift to more belowground C allocation. It also successfully simulates the controls on N fixation rates and captures its responses to elevated CO2 and N fertiliser additions.
So if we believe that with such a model we have robust predictive capabilities, we can start looking into the long-term response of the coupled system. And there are some interesting features regarding N limitation. The same model that reproduces the strong N limitation of the aboveground growth stimulation under elevated CO2 simulates a trajectory of progressive release from N limitation (Fig. 8). This indicates that N limitation is not a strict cap, but affects vegetation functioning so that growth comes at an additional cost, but there is flexibility in accessing additional N if required. This is even without any N fixation in the system. However, these mechanisms play out only in the long run. Here, according to the model, at time scales of decades. Ecosystem manipulation experiments cannot usually be maintained that long.
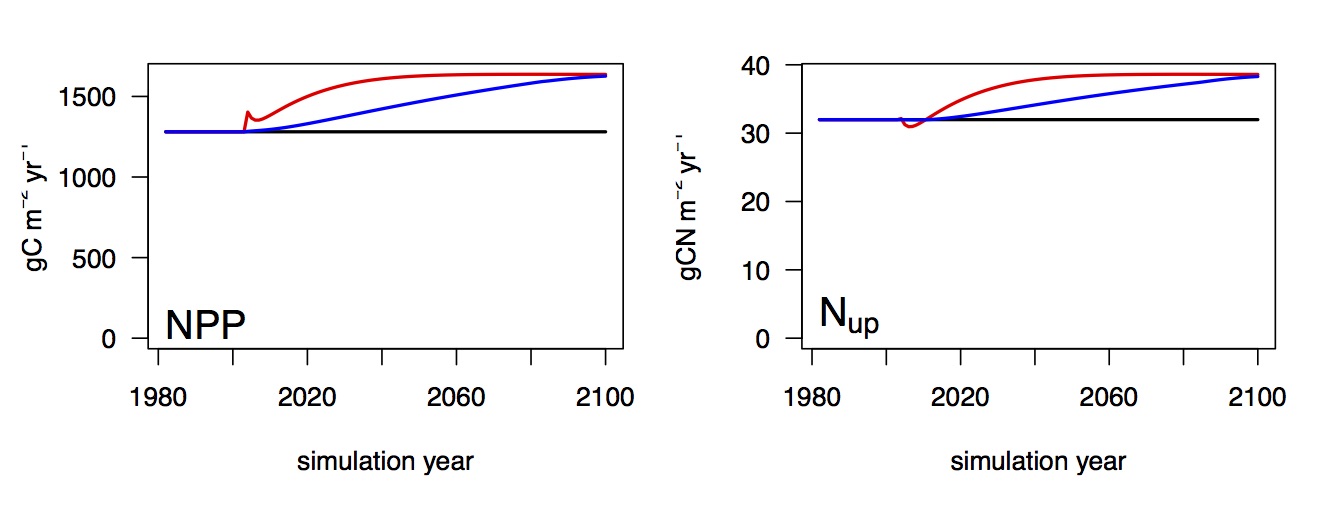
Fig. 8 Long term evolution of NPP and N uptake in response to a step increase in CO2 (red) and a gradual increase (blue).
What is the conclusion of this? We need manipulation experiments. They are absolutely essential for understanding how the system responds to global environmental change and to evaluate models. But here, I might be preaching to the choir (This here is presented to a conference of ecosystem manipulators). I hope I also convinced you that we need models along with the data, and even more importantly: a strong interaction between modelers and experimentalists. From observations alone we cannot directly make predictions for a highly coupled system. Anecdotal systems understanding (e.g. PNL, …) is too often faced with seemingly counterintuitive systems behaviour. Neither should modellers treat confrontation of model results with data as a “end-of-the-pipe” exercise that can only lead to the conclusion that “the model does a reasonable job” (when looking at it from a save distance) [citing Colin Prentice]. Instead, we should embrace a model-data-circle, as advocated by the FACE-MDS team and published by Medlyn et al. (2015). Assumption-centered model evaluation.

Fig. 9 Assumption-driven model-data-circle. Adopted based on Medlyn et al. (2015).