LSD Heatscatter with ggplot

I love the heatscatter() function from the LSD R package. I’ve even used it for my own publications (see Figs. 2 and 7 in Stocker et al. 2017). Since having written this paper and creating the figures I’ve (finally) moved to using ggplot. Unfortunately, heatscatter() creates a plot in base R.
Googling, I found no satisfying solution. What is described on this blog does’t really do the trick.
I tried another approach. I forked the LSD library into my github and hacked an additional argument into the heatscatter() function as:
ggplot a logical: if TRUE uses the ggplot2 library to create plots. Defaults to FALSE.
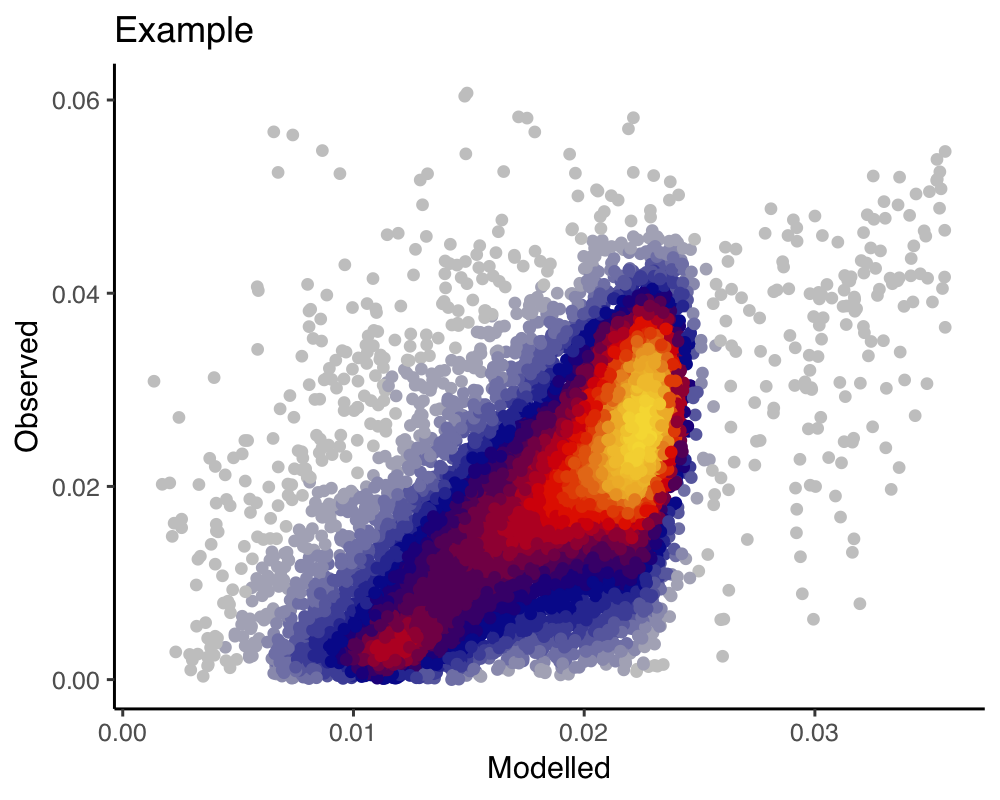
When set to TRUE, the function returns a ggplot object. For example the following bit of code …
gg <- heatscatter(mdf$lue_mod, mdf$lue_obs, xlab = "Modelled", ylab = "Observed", ggplot = TRUE)
gg + lab(title = "Example")
… prints a simple plot, by default (and hard-coded), using ggplot’s theme_classic(). This looks like this:
That’s it. A direct link to the hacked heatscatter() function is here.
Credits to the halluzinogenic LSD package developer Bjoern Schwalb!